
Make the real-estate call on live occupancy data — not last quarter's guess
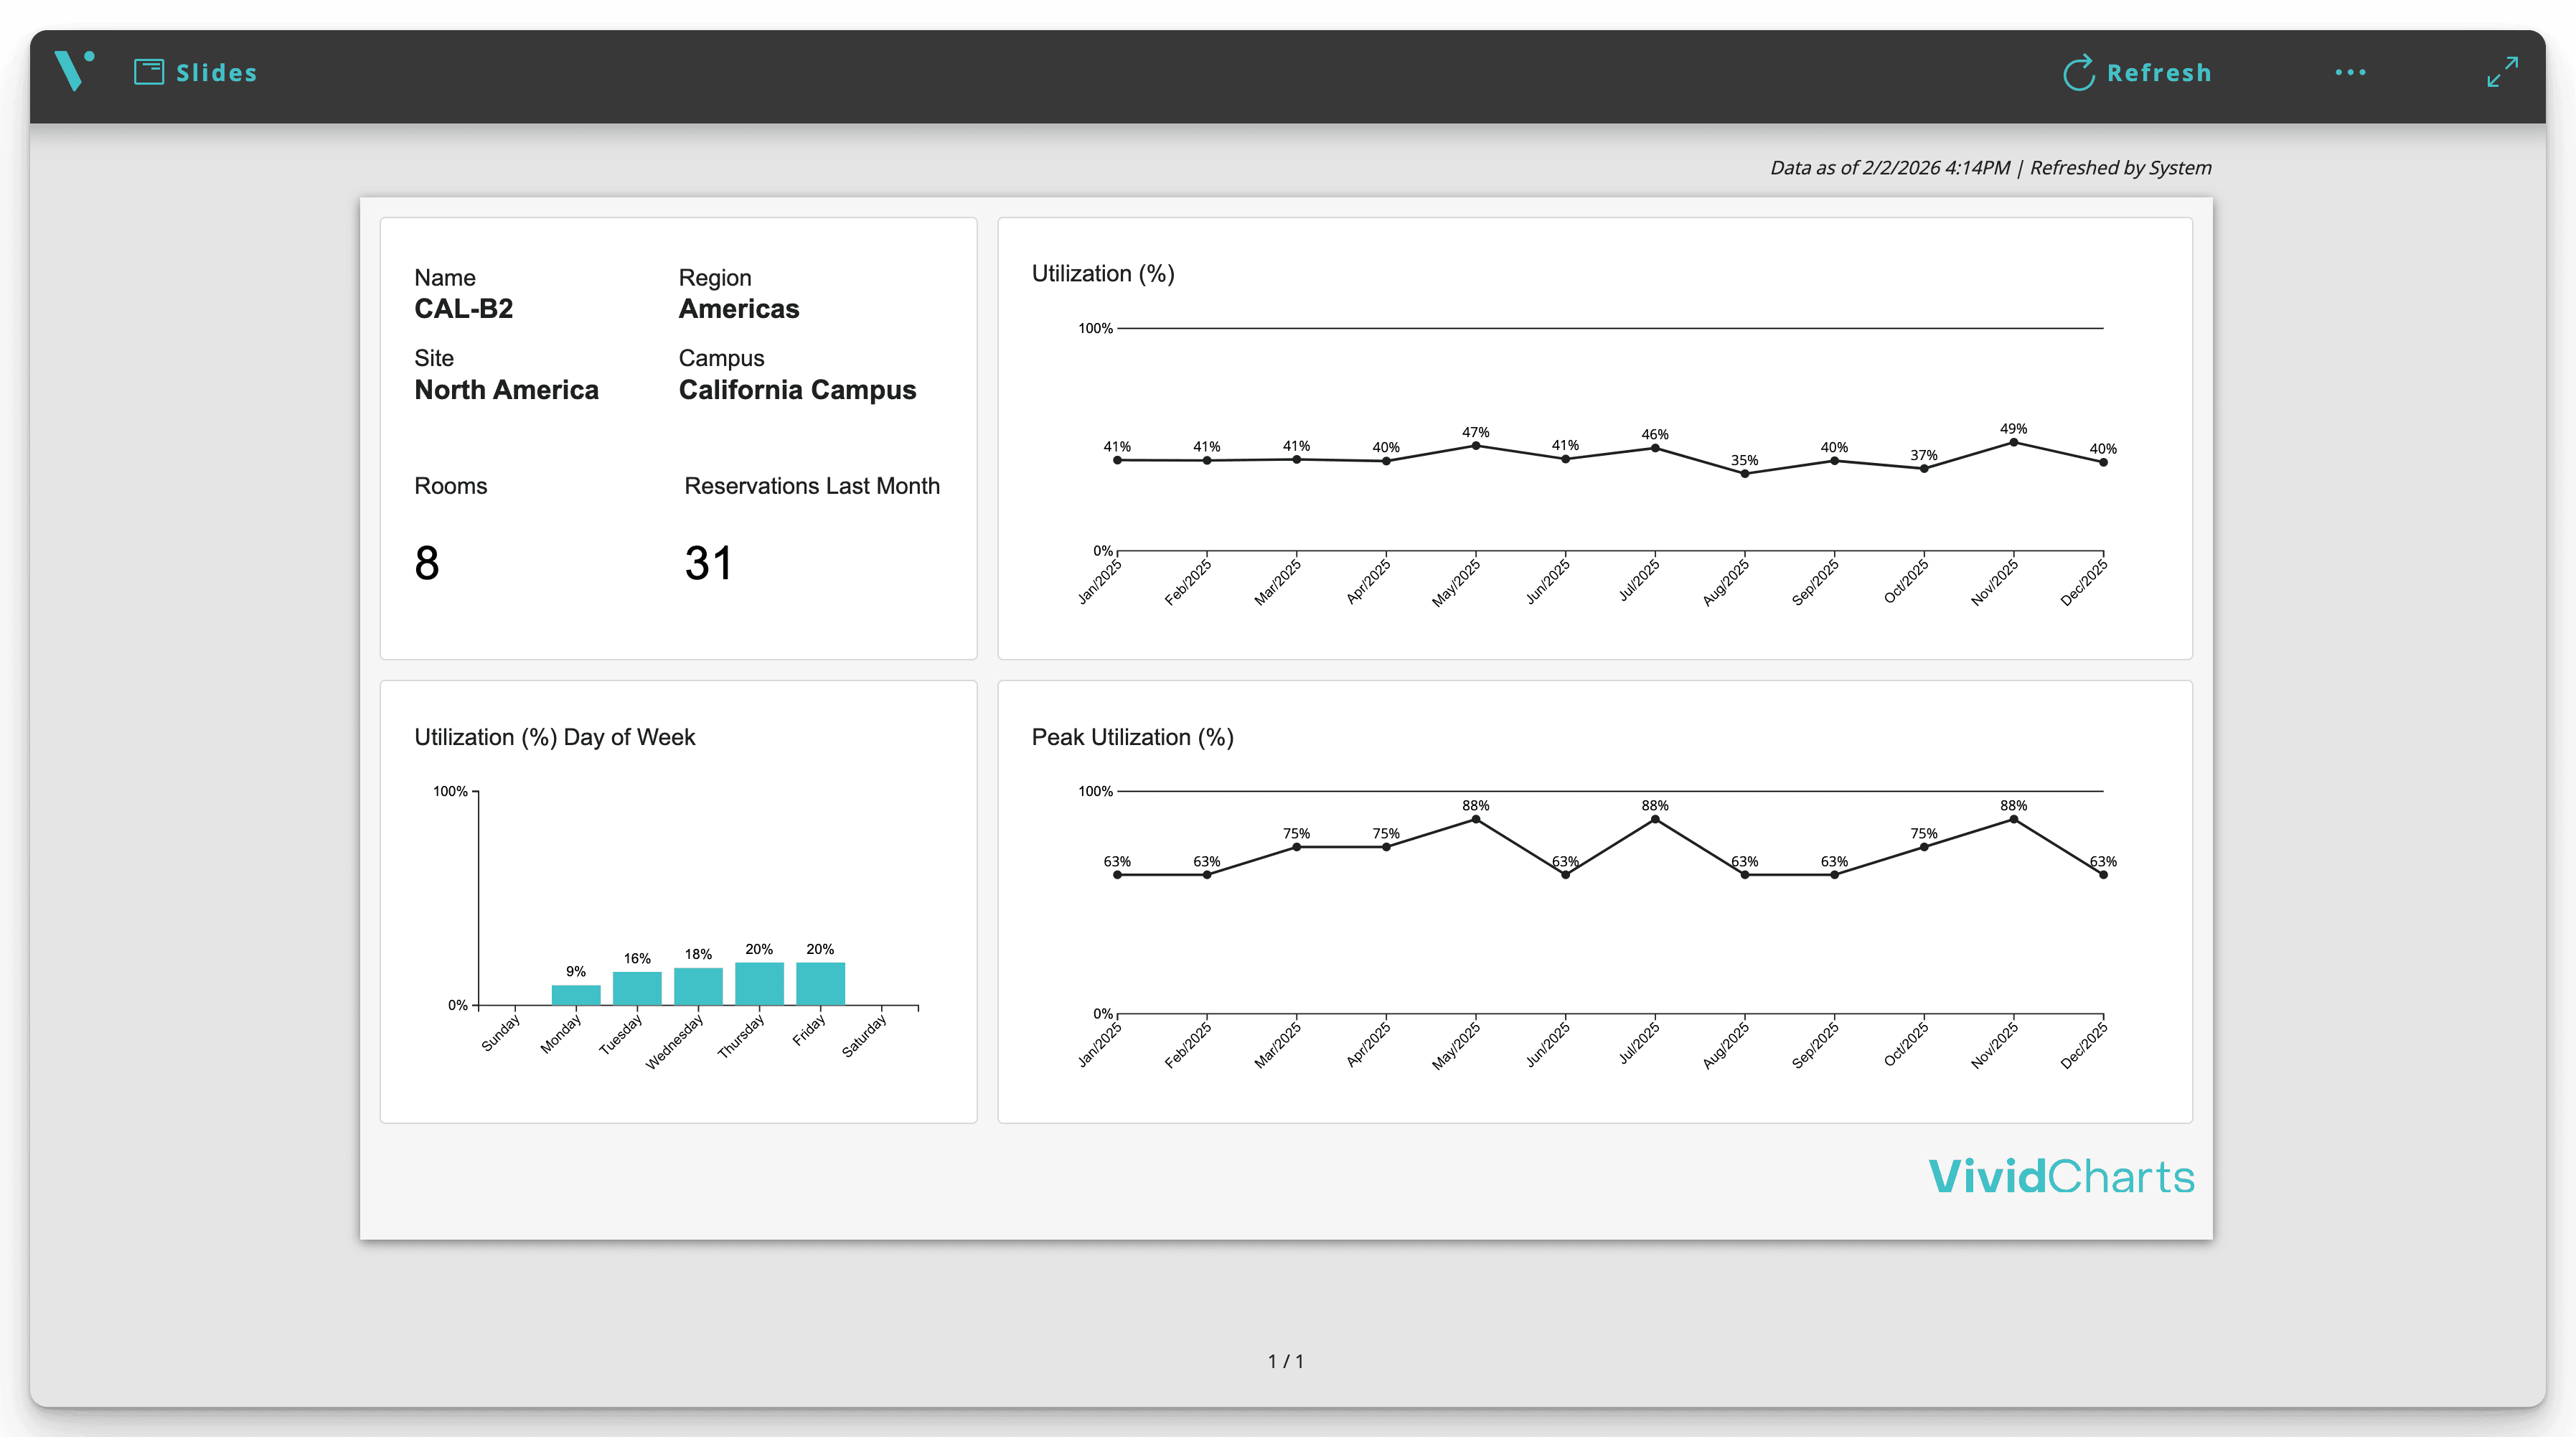
The Building Utilization Report is a ready-to-run ReportFlow that turns your live ServiceNow Workplace data into a clear view of space, occupancy and utilization by building and floor — current the moment you open it.
Million-dollar space decisions, made on stale spreadsheets
Reservation logs, occupancy sensors and space records live in different places, so utilization gets stitched together by hand — weeks after the question was asked.
When utilization is assembled manually, the picture is always behind reality: under-used floors keep their leases, growing teams stay cramped, and nobody can show the board what the portfolio actually costs per occupied seat. The Building Utilization Report pulls space, reservation and occupancy data live from ServiceNow Workplace and turns it into a current utilization view — by building, floor and neighborhood — so real-estate decisions rest on what's happening now.
Everything your report needs — automated
Occupancy and utilization, live
Seat, room and floor utilization roll up automatically from reservations and occupancy data — no manual tallies.
Building, floor and neighborhood views
Drill from the whole portfolio down to a single neighborhood without rebuilding the report.
Peak vs. average demand
See true peak occupancy against the daily average, so you right-size space instead of over-leasing for the busiest hour.
Cost-per-seat context
Pair utilization with space cost to expose the floors quietly draining the real-estate budget.
One template, every site
Design the report once and it renders for every building and region from the same live data.
Board-ready exports
Export a polished PDF or PPT for the real-estate review that reads consistently every cycle.
From reporting chore to running advantage
Right-size with confidence
Live utilization shows which floors to consolidate and where teams need more room — backed by data, not anecdotes.
Defend the real-estate budget
Cost-per-occupied-seat gives leadership a number to act on when leases come up for renewal.
Always ready for the portfolio review
The report is current on open, so workplace leaders walk into planning with the live picture, not a month-old export.
A real Building Utilization Report, running on live data
Open a live ServiceNow instance and walk a fully-built Building Utilization Report — the same one your team would publish. No slides to assemble, nothing to install.
Stop renewing leases on floors nobody uses. Live utilization by building changes the conversation — and the budget.
Explore related ReportFlows & resources
See it on your own data
Spin up a live instance to explore the Building Utilization Report ReportFlow yourself, or book a walkthrough with our team.
- Walk a fully-built Building Utilization Report on live data
- See how it maps to your ServiceNow tables
- Get your reporting questions answered, no pressure
Start with a live instance
We'll send a private ServiceNow instance with this report, ready to explore — no install, no sales call.
or get started instead →No install · runs inside ServiceNow · nothing routes through a VividCharts cloud