Executive-ready, automated ServiceNow reporting — built where your data already lives.
Build reports natively, keep them current automatically, and turn them into decks leadership trusts — without exporting a single row or rebuilding a deck every month.
Build it. Automate it. Present it.
Every capability in VividCharts belongs to one of three jobs. Start with the overview here, then go deep on the one you need.
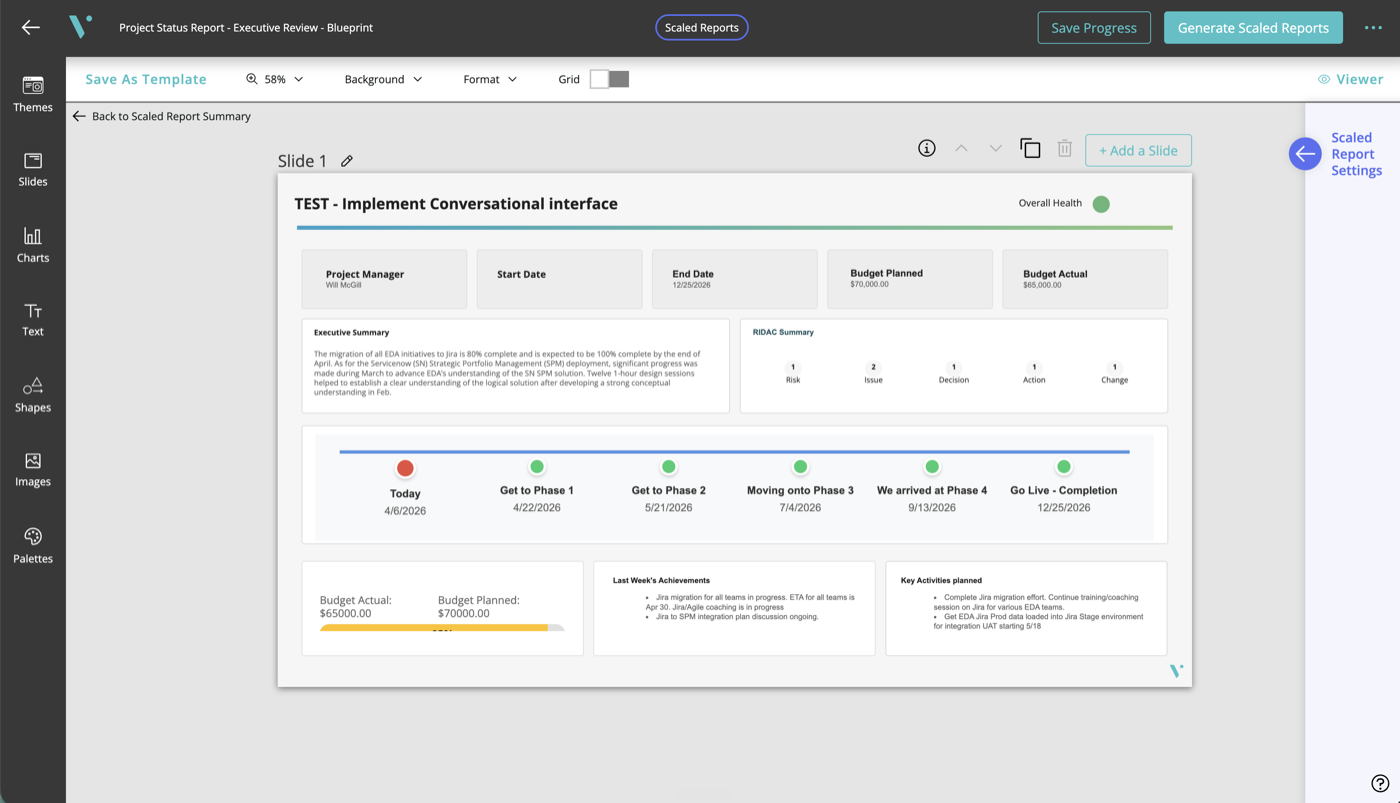
Author reports and dashboards natively in ServiceNow.
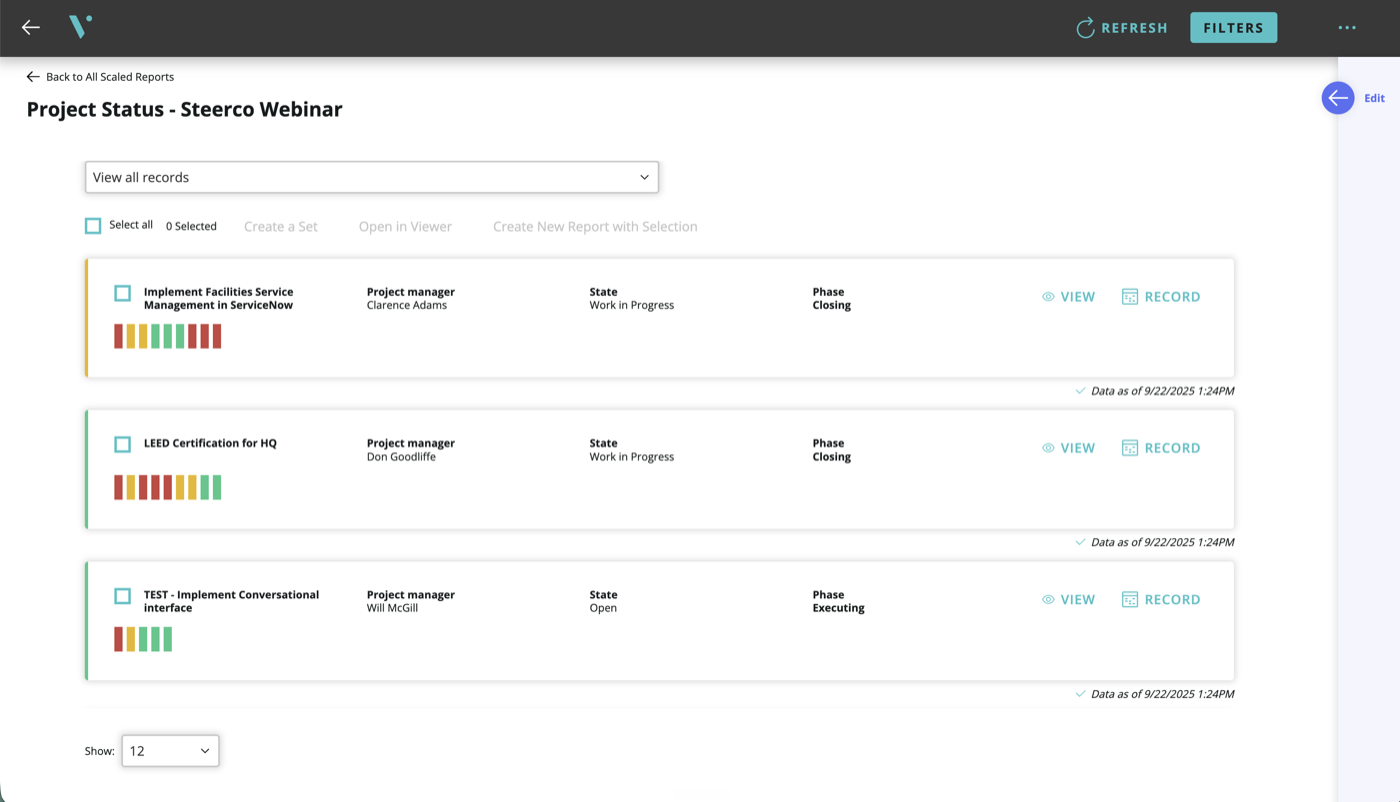
Refresh and deliver reports on schedule — automatically.
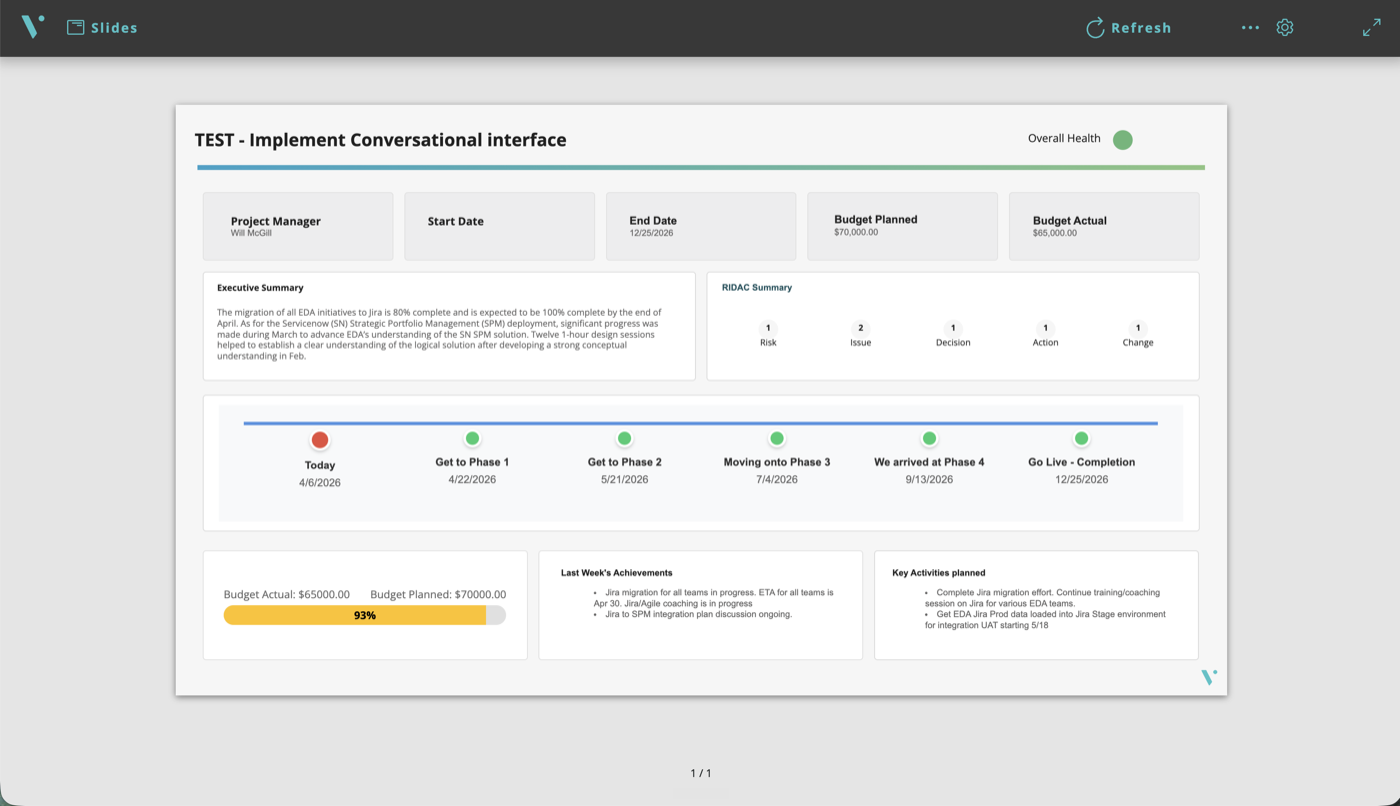
Package live data into decks leadership trusts.
Underneath it all: native on the ServiceNow Platform
Because every step runs inside your instance, VividCharts inherits the security, governance and compliance you already trust. Nothing to export, nothing extra to defend.
Build, automate and present — applied to your team's work
The same platform powers ready-to-use reporting for every ServiceNow practice. Pick the use case closest to your team and see the reports already mapped to your data.
IT Service Management
Incident, problem and change reporting leadership can read at a glance.
Explore ITSM SPMStrategic Portfolio Management
Portfolio, demand and project health rolled up for executive review.
Explore SPM CSMCustomer Service Management
Case volume, SLA and CSAT reporting kept current automatically.
Explore CSMSee the whole platform on your own data
In a focused walkthrough we'll build, automate and present a report from your instance — start to finish, in one sitting.