Install directly in your instance. Your data stays secure.
VividCharts allows you to automate your most time-consuming reports and presentations. You're not building those manually for the fun of it. Your ServiceNow data drives your business.
Your leadership, customers, and peers depend on these reports. You don't need to make them wait while you're working in PowerPoint.
 Schedule Demo >
 VividSheets is a spreadsheet interface directly in your ServiceNow instance that allows you to build the automated calculations you need to deliver reports. It even integrates with VividCharts.
Instead of dumping data into Excel, bi-directionally tie your formulas directly to your source data.
 Install Now >
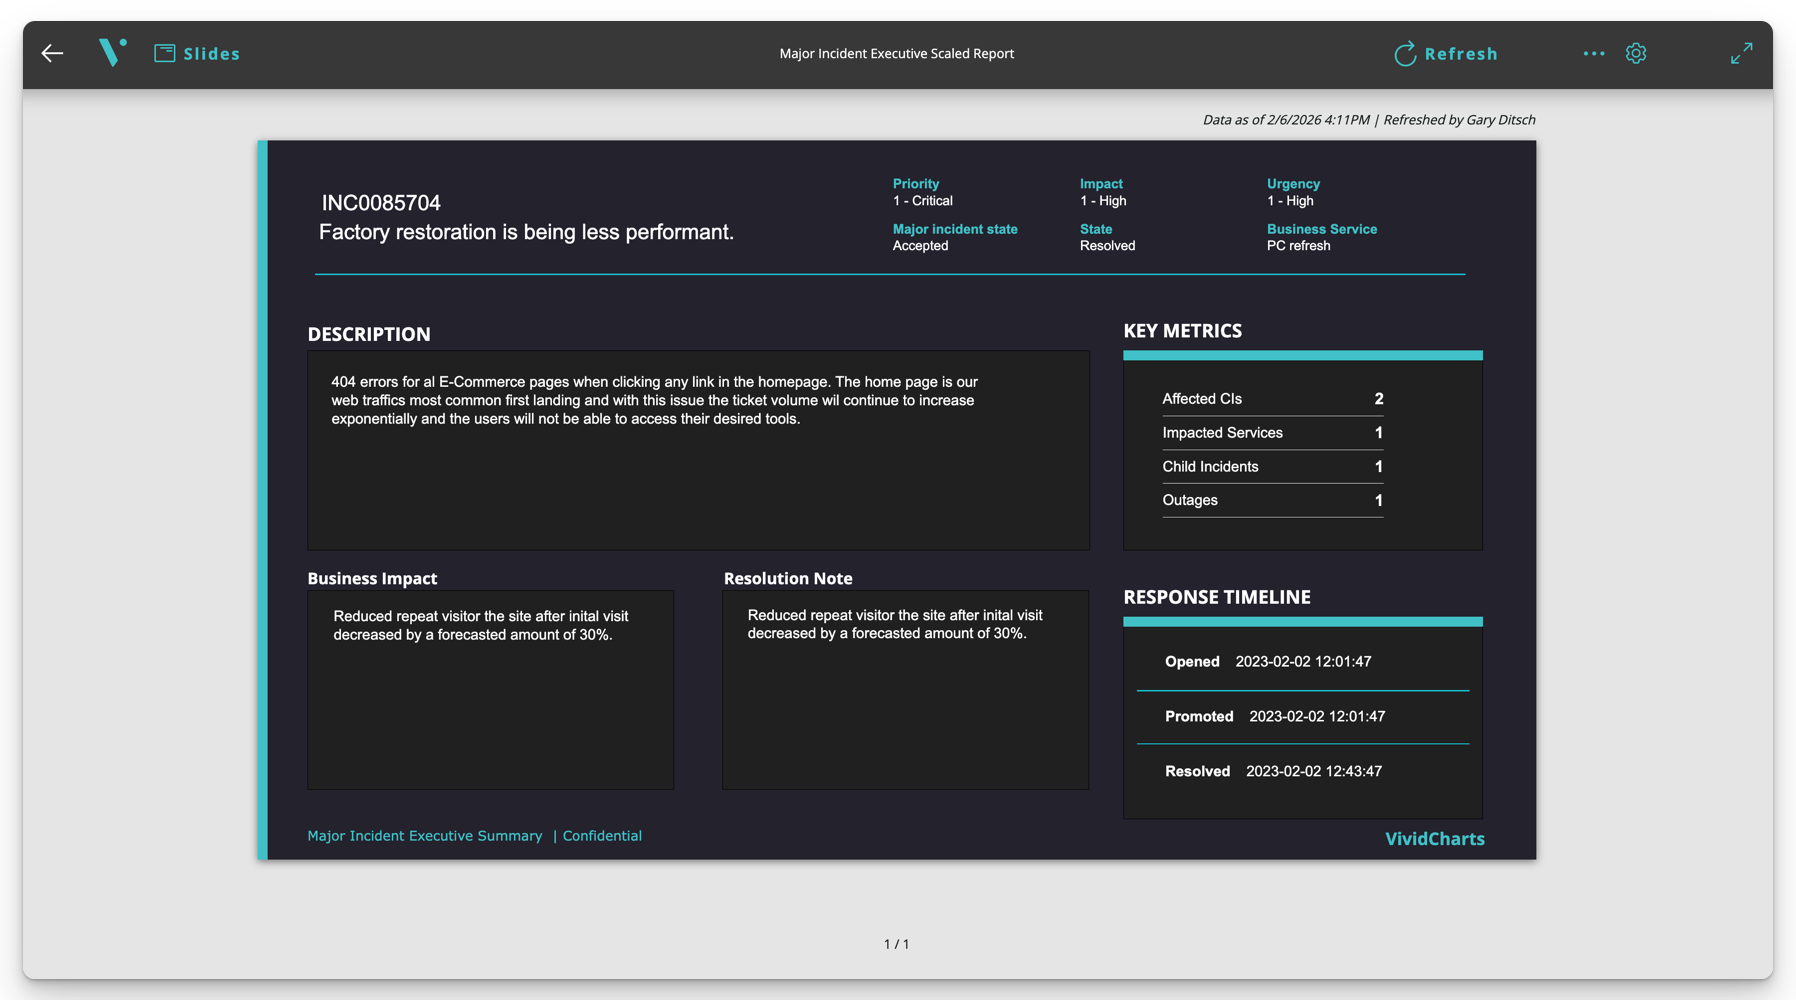
Your leadership, customers, and stakeholders need to know what's going on within ServiceNow so they can make decisions. That's why you've been building long slide decks manually with ServiceNow data. Maybe even using screenshots.
VividCharts allows you to create that slide deck once, tie it to your data, and have it ready to go in a moment's notice.
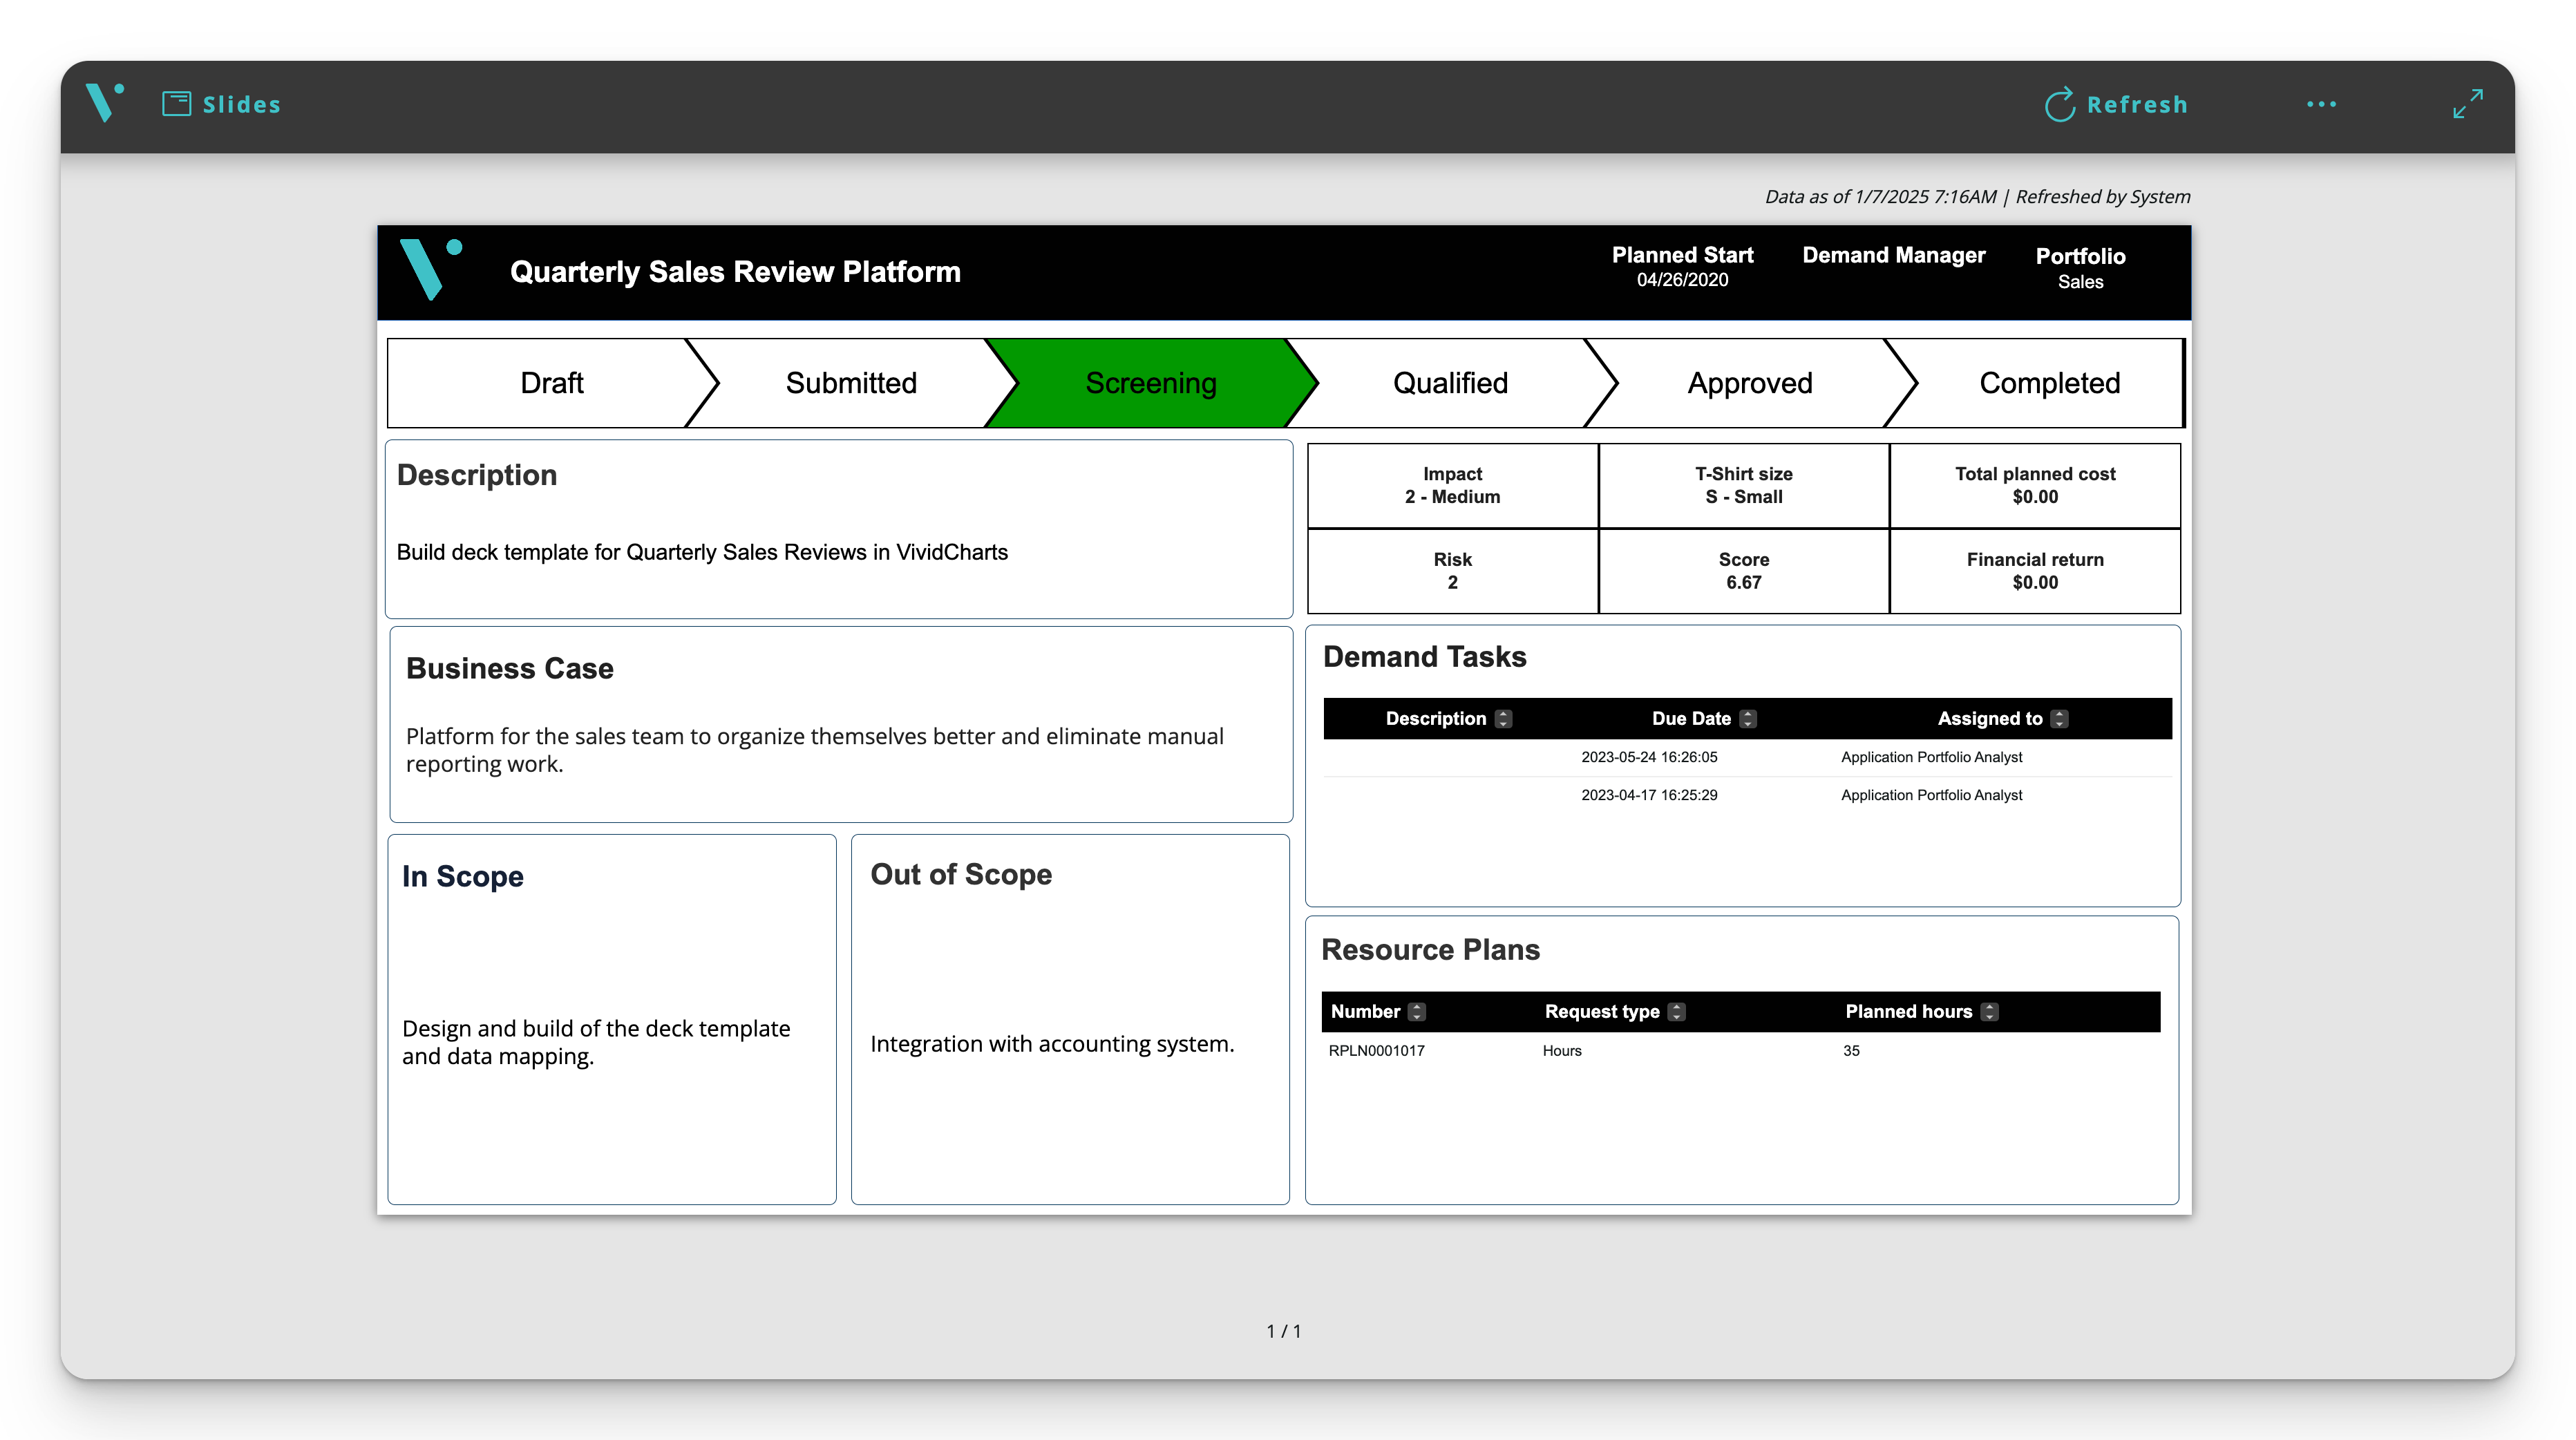
Your leaders and stakeholders have reporting needs that don't always fit within the limits of out-of-the-box reporting. They also have visual expectations you aren't able to meet today.
VividCharts brings the flexibility to create the exact visuals they need and present it to them in a polished format.
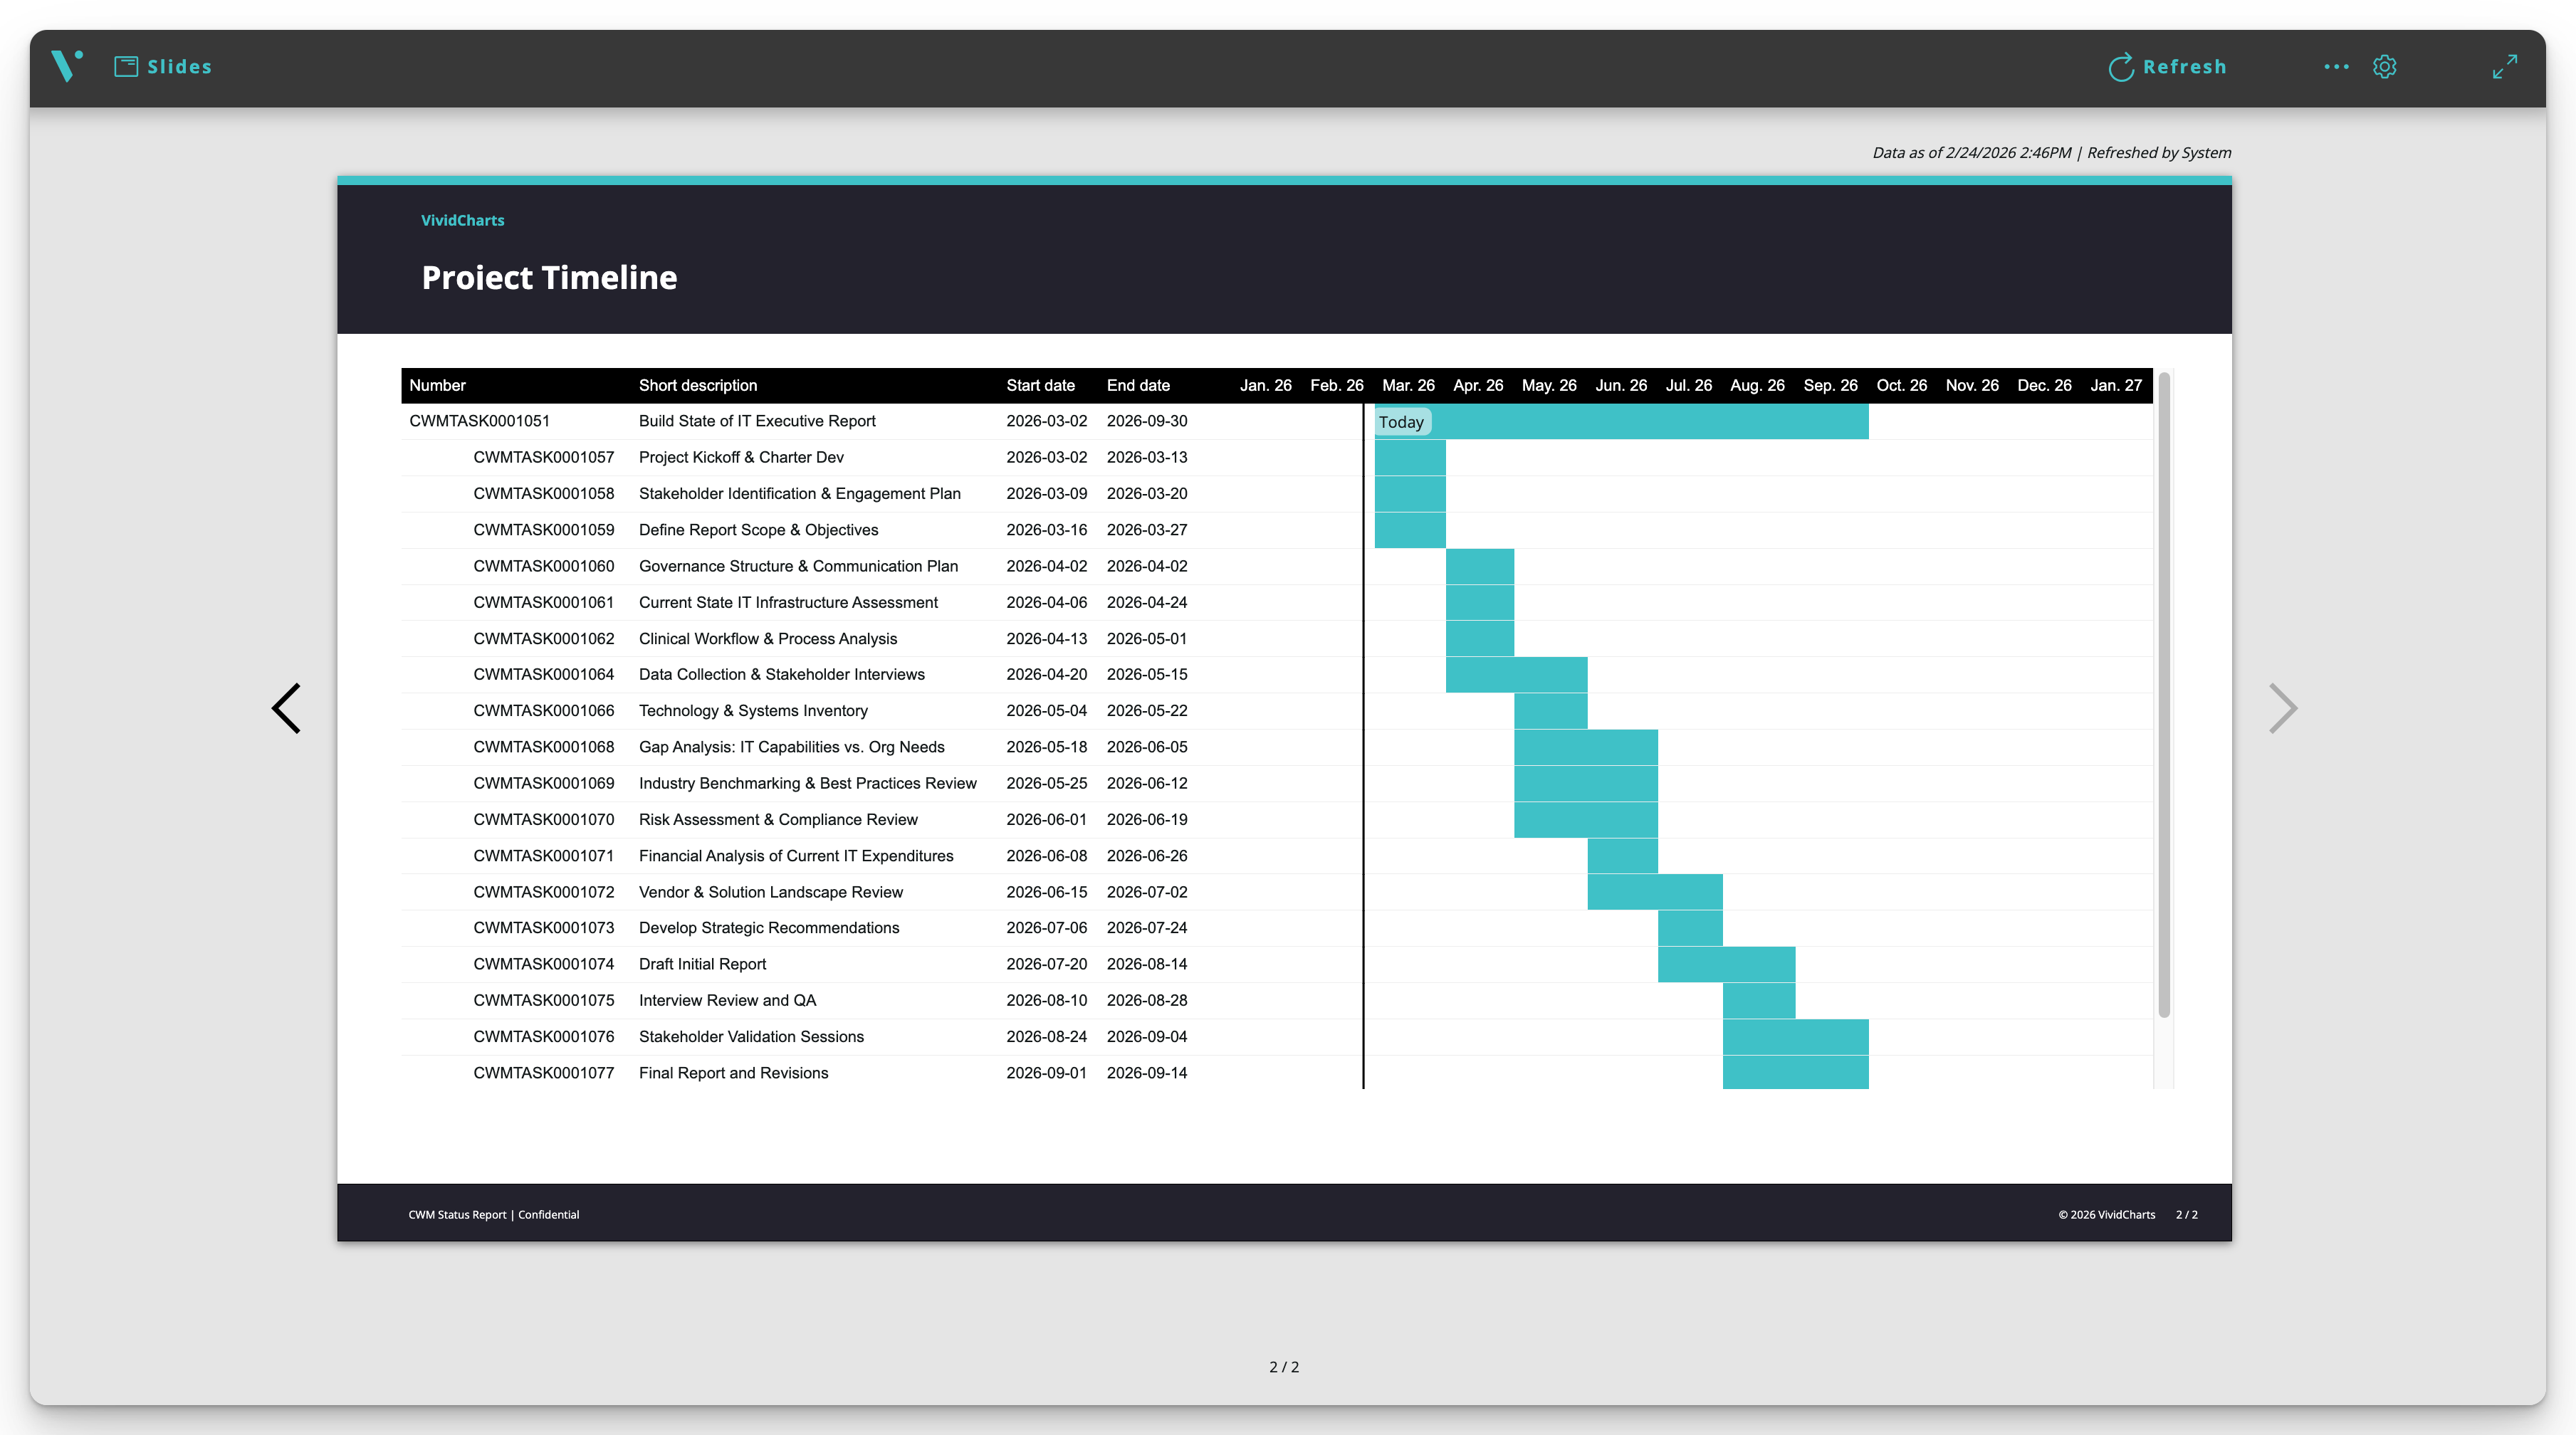
Standardization is important. If your team is producing 20 different versions of the "same" report, you'll never accurately assess what's going on.
VividCharts has advanced data mapping that allows you to create a template report and then run it against however many records you need.
When all that's missing from a report is a simple calculation, you find yourself dumping your ServiceNow data to Excel.
VividSheets has specialized functions (that can even write back to records) that allow you to create calculations and then reference in a VividCharts report.
When you are trying to displace a manually built PowerPoint deck, you need flexibility. Our free form editor combines flexibility with your ServiceNow data.
Run presentations and drive steering meetings directly from your instance. You have up to date data and the access to the data with a click.
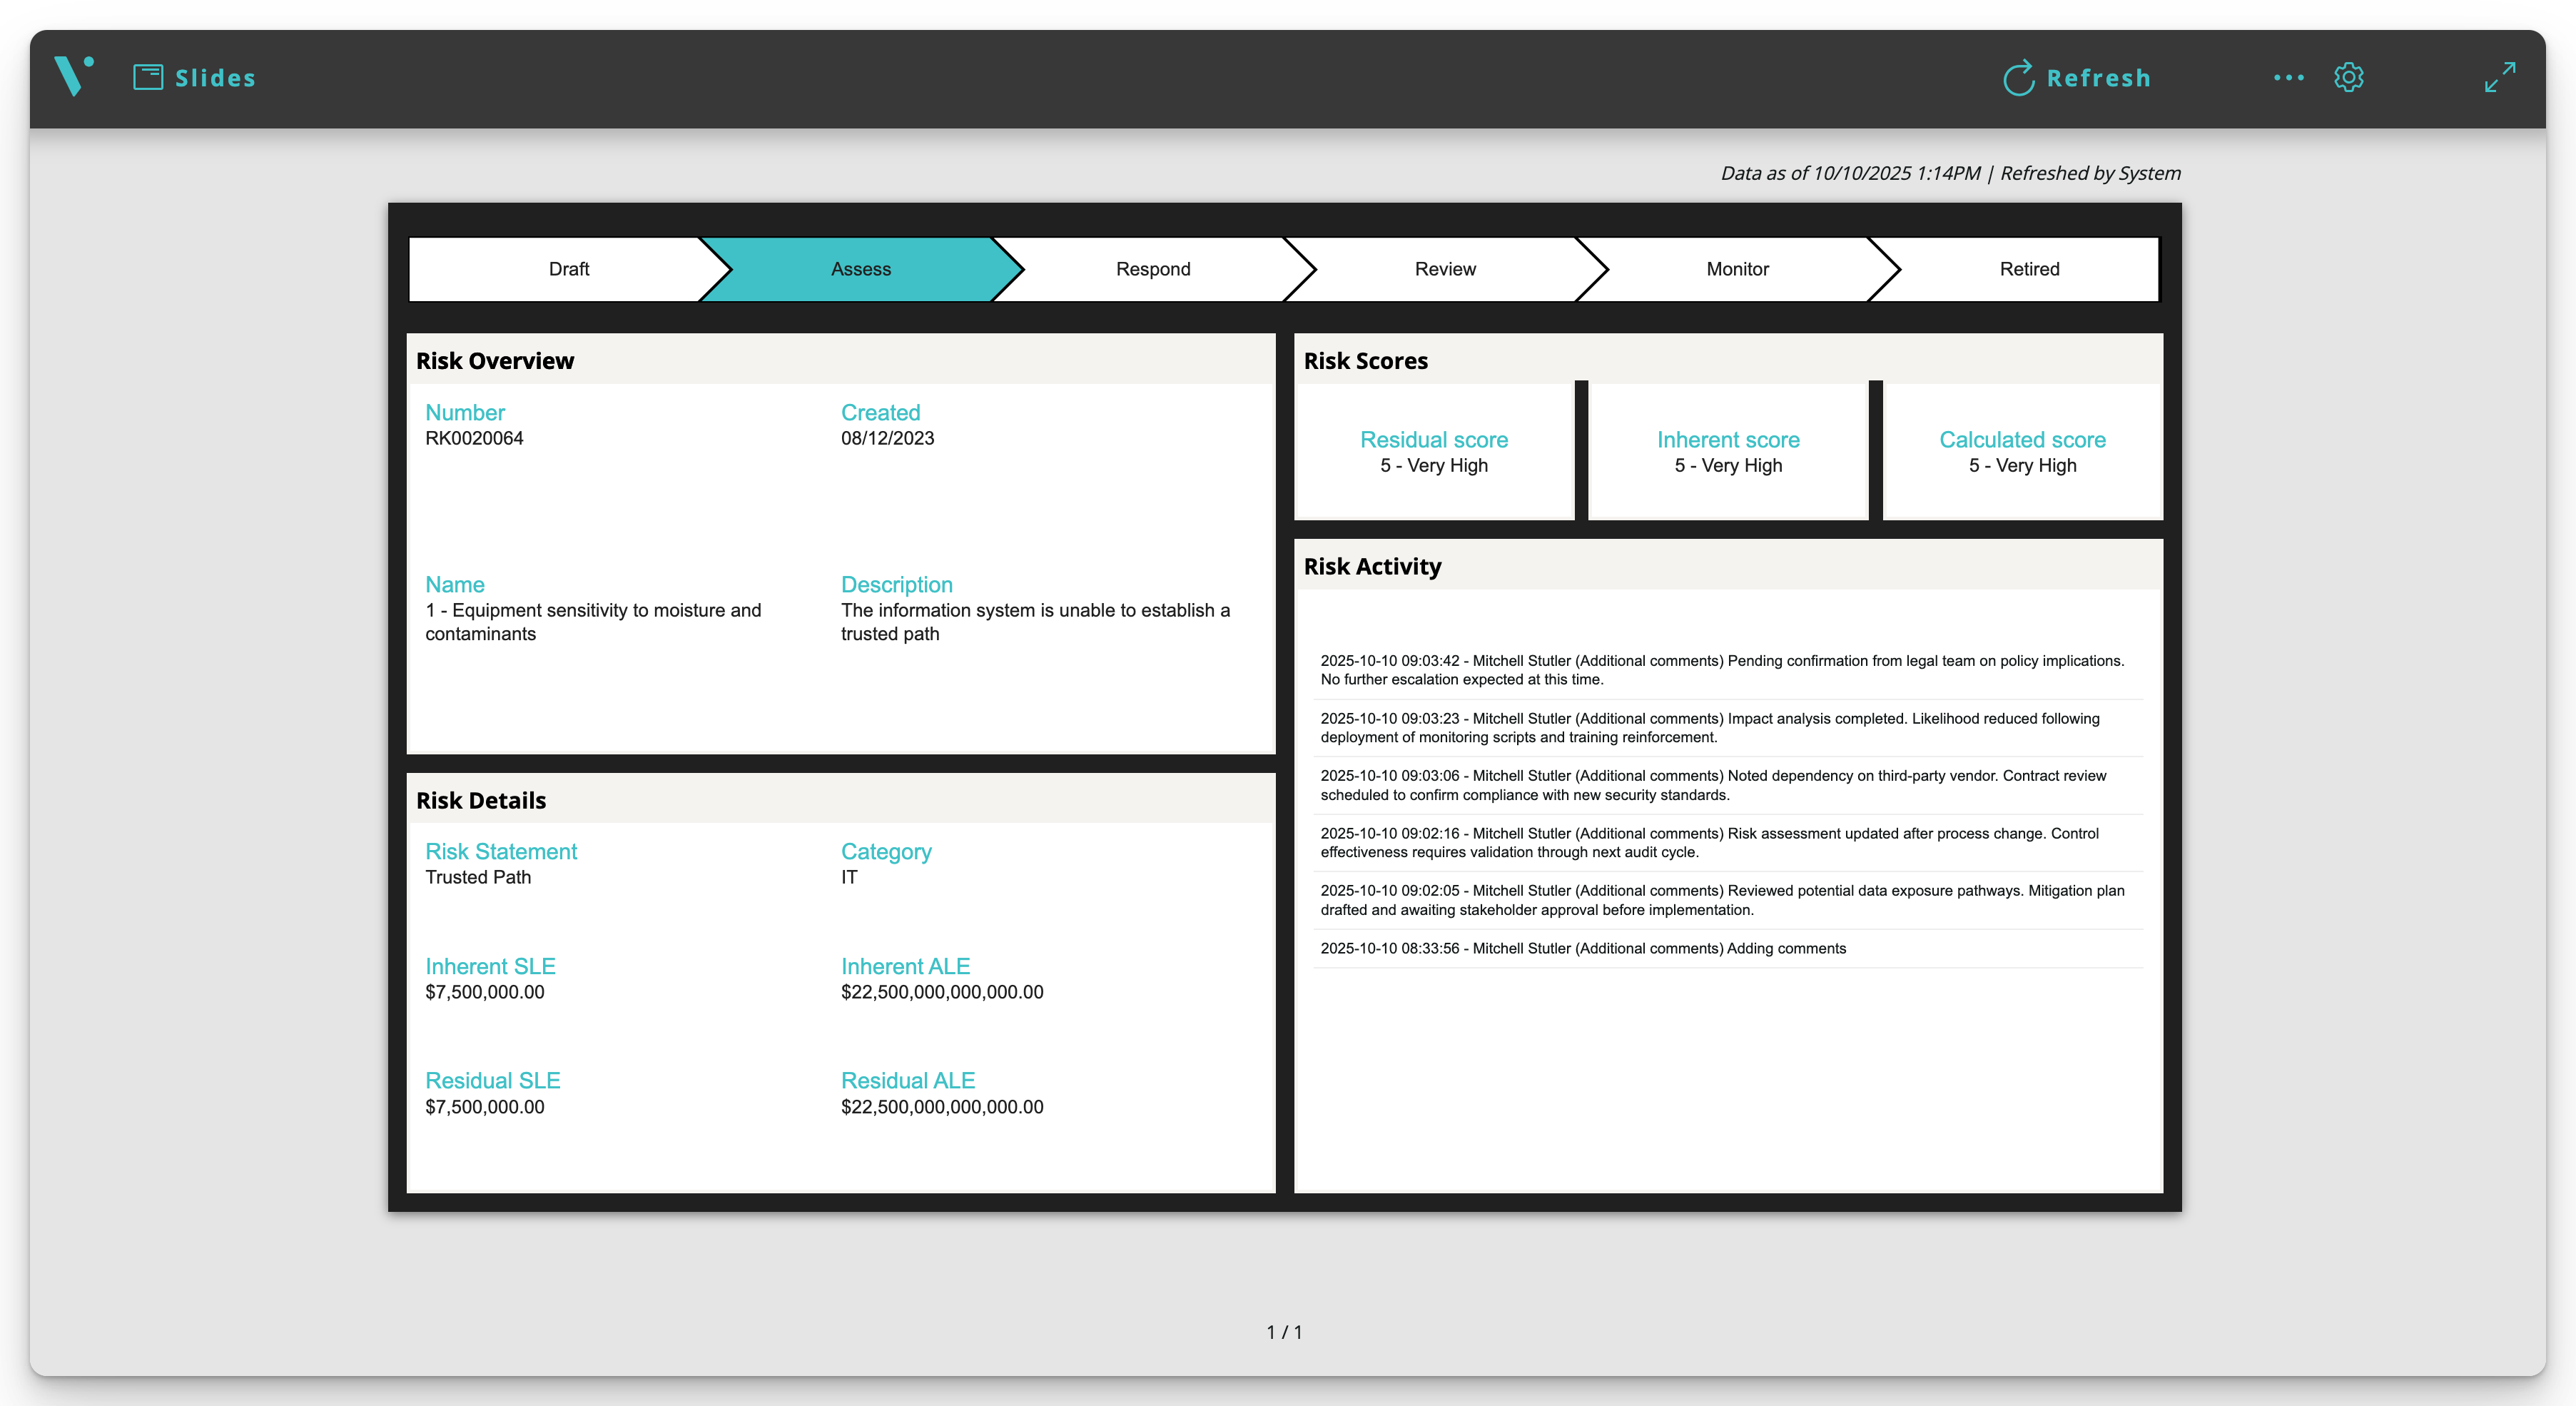
Our chart library has over 60 out-of-the-box visuals with a plethora of style options. You won't have to compromise when meeting a stakeholder request.
Our products give you the ability to create specific calculations. Whether a cell function in VividSheets or a calculated column in a VividCharts list, we've got you covered.
VividCharts has the ability to create both scripted data collections and visuals. We can handle any visual you need with your ServiceNow data.
Sometimes you still need a hard file. We provide PPT, PDF, PNG, and Excel exports that keep your reports true to form.
To scale a standard report to 1000's of users, we provide advanced data mapping to translate a template into functional reports for all.
Using our Collections, you can provide your leaders and stakeholder with a specific link that has all of the reports they need. No filtering through thousands of options.
Read from ServiceNow tables directly into a cell and even write back from a cell into a record's field.
Our platform powers solutions to your biggest data problems