IT Service Management

//
SLA Monthly Scorecard

Turn SLA data into decisions.

Problem

ServiceNow tracks mountains of SLA activity, but leaders rarely see a clear, timely picture of what’s meeting the target, what’s breaching, and where to act. Manual exports, scattered charts, and inconsistent views slow reviews and bury trends.

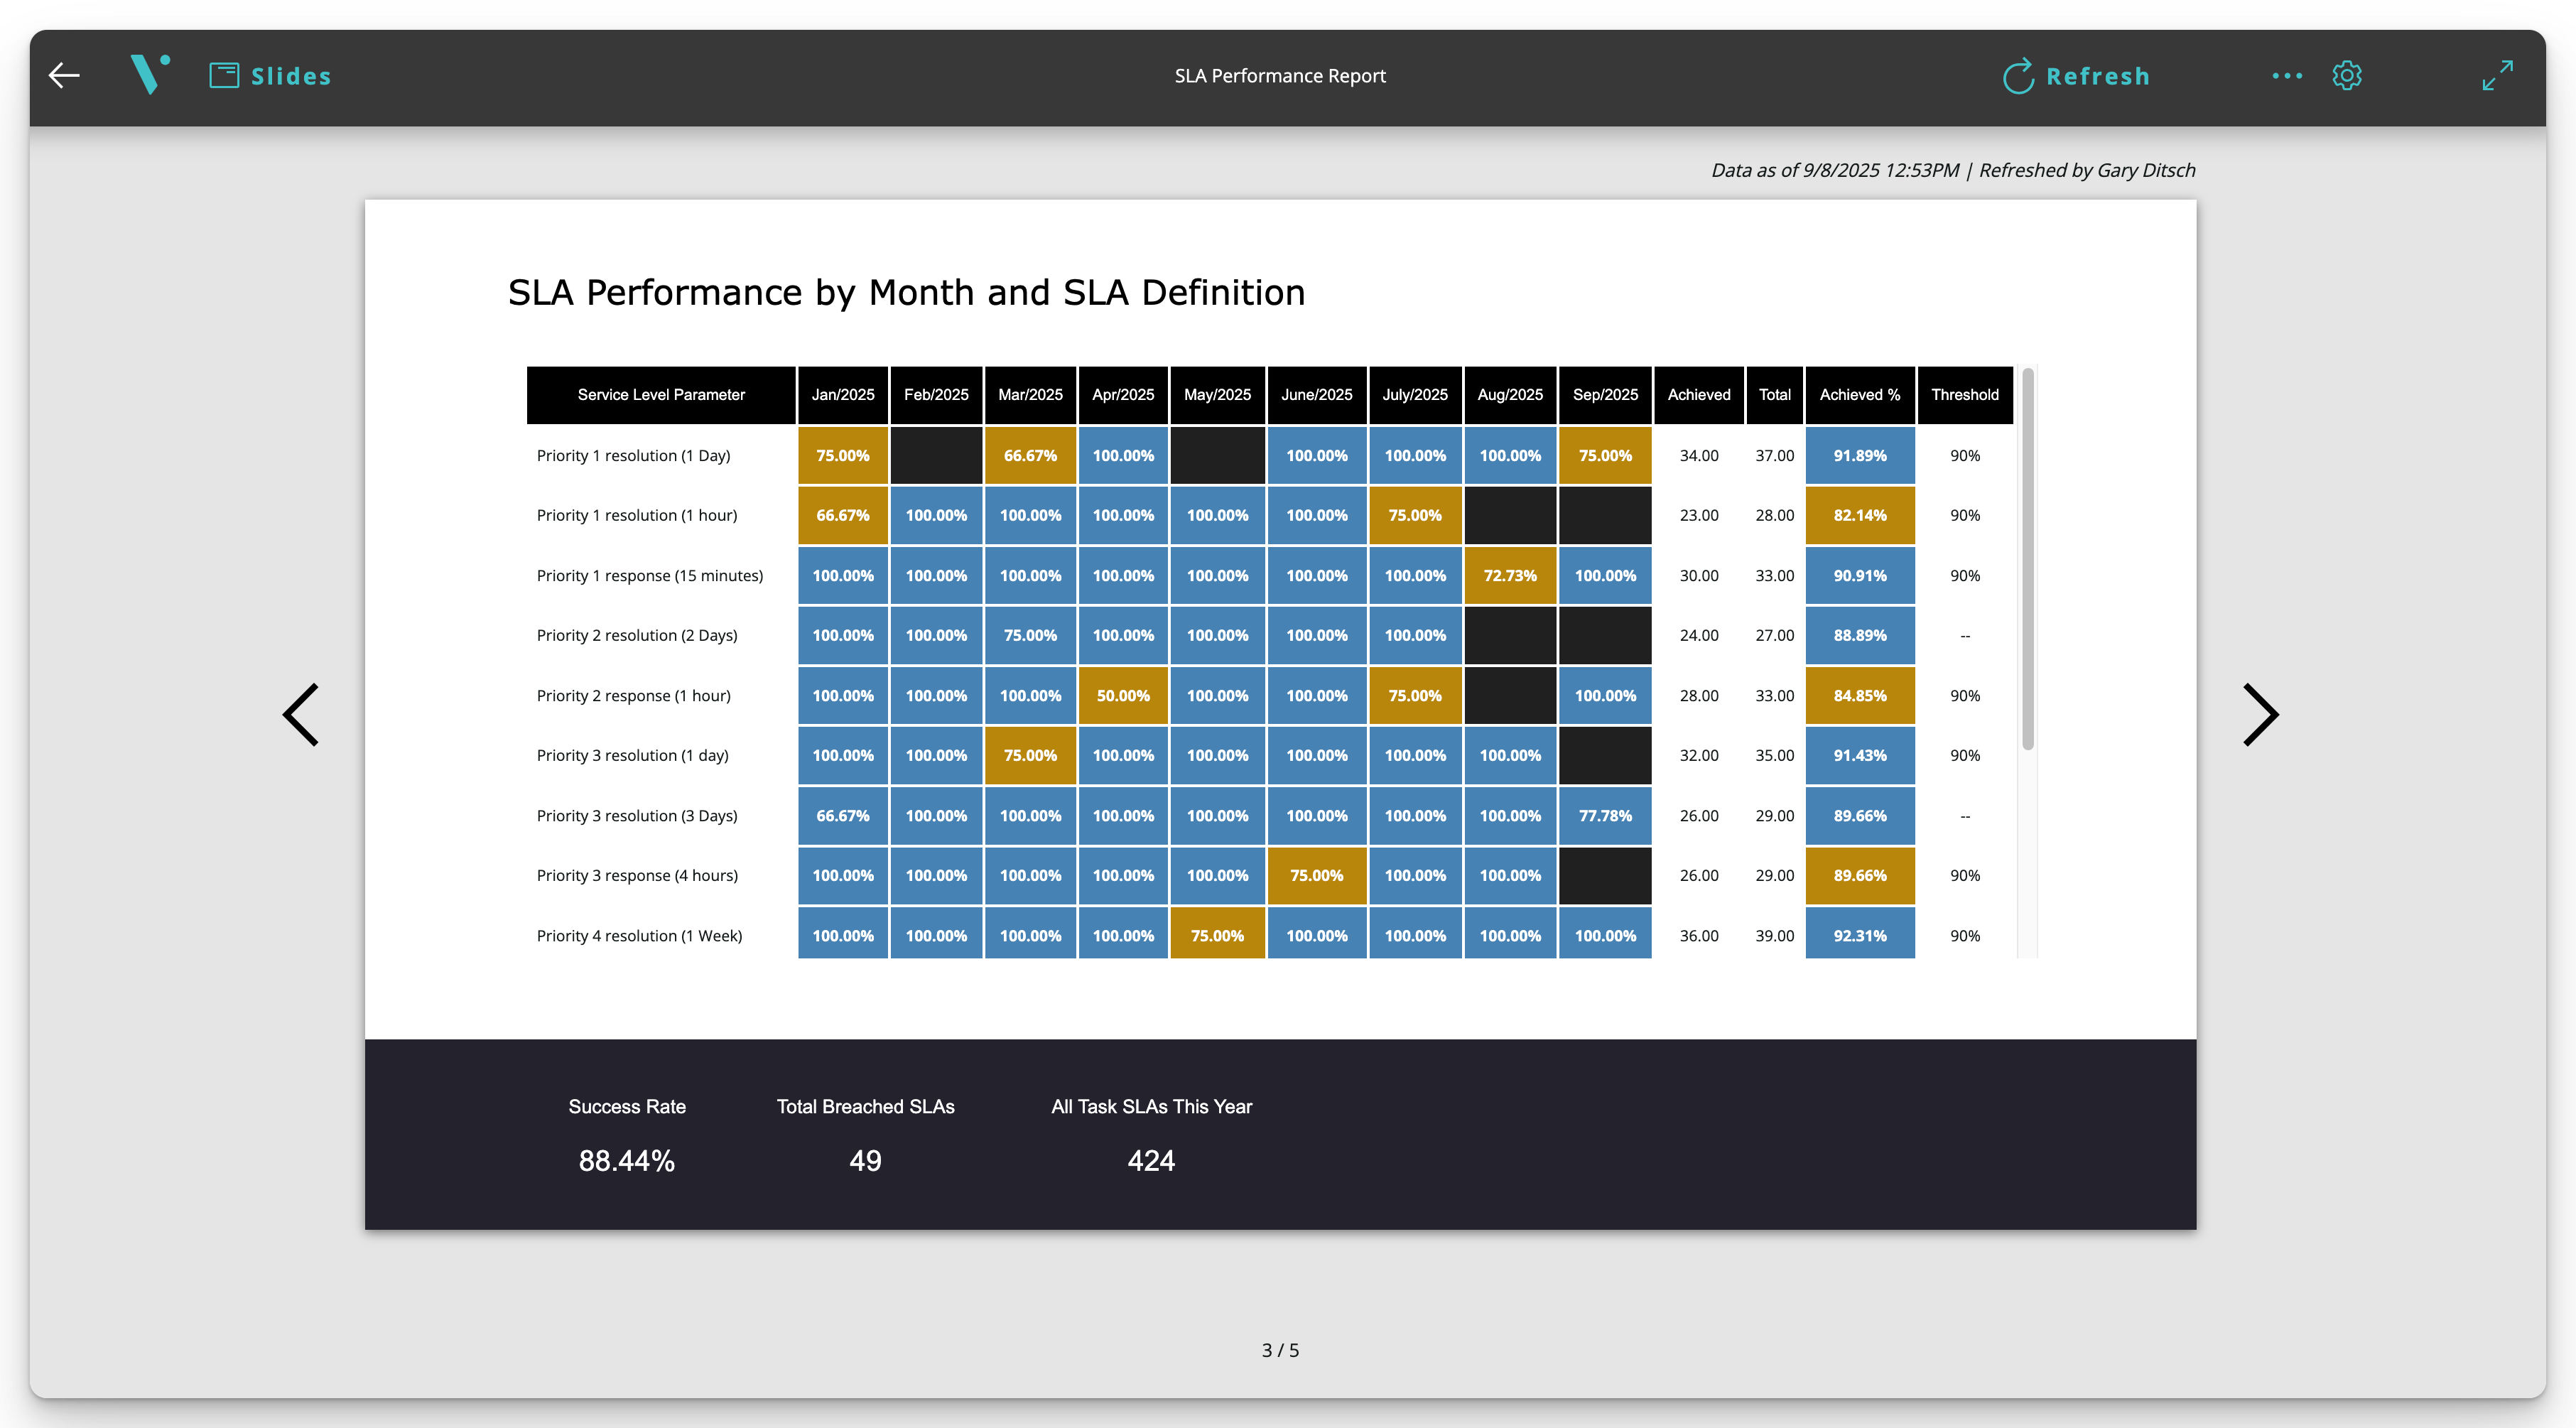
The SLA Performance Report replaces that chaos with a single, executive-ready view that highlights achieved vs. breached performance, trends over time, and the targets that matter, directly within your ServiceNow instance.

Features

  • SLA Table: A purpose-built table that summarizes SLA definitions across time with clear indicators for met vs. missed targets.
  • Target lines & benchmarks with dynamic multipliers: Add goal lines (e.g., 80%, 90%, 95%) and compare actuals to targets using the Combo Chart multipliers.
  • Tight, meaningful trends: Focus reviews on the performance band that matters (e.g., 85–100%) with custom axes so small movements are visible and actionable.
  • Executive-ready delivery: Export to PPT/PDF/PNG and schedule distribution so stakeholders receive the same polished story.

Benefits

  • Faster, better decisions: Spot risk and momentum instantly with a single, consistent report everyone understands.
  • Less manual work: Automate your SLA review workflow and keep everything live on ServiceNow. Remove the workflows that include spreadsheets and copy/paste efforts.
  • Stronger accountability: Clear targets, trend lines, and breach visibility make priorities obvious and drive focused actions.

Related Resources

Book a Demo

Ready for a deep dive into this ReportFlow? Schedule a demo and we can:

  • Walk through the details of this ReportFlow
  • Explore any other ReportFlows you're interested in
  • Answer any questions around your reporting challenges
Easy to use
Professional
Responsive
Amazing
Engaging
Always improving
Accommodating
Friendly
Wonderful
Robust
Passionate